~/abhipraya
PPL: Quality Gates That Actually Block Bad Code
Quality tools are useless if they are not enforced. Our project had SonarQube analyzing every commit, schema fuzzing running against our API, and load tests measuring latency, but every single one of them was set to allow_failure: true. Violations were silently ignored, real bugs slipped through, and nobody noticed because the pipeline was always green. This blog covers how we turned those advisory checks into blocking gates, built automated CI reporting so reviewers could actually see the results, and watched the tools catch a JWT vulnerability, a production crash, and 31 code quality violations that had been accumulating for weeks.
Note: Our project is hosted on an internal GitLab instance, so we use the term MR (Merge Request) throughout this blog. If you’re coming from GitHub, MRs are the equivalent of Pull Requests (PRs).
The Quality Gate That Actually Blocks Bad Code
Having tools is different from enforcing tools. SonarQube had been analyzing our code for weeks, but with allow_failure: true on the CI job, every violation was silently ignored. The quality gate was failing, and nobody noticed.
We changed that in one commit: removed allow_failure from sonar-scan and security:sast, removed --exit-zero from Bandit, and added sonar.qualitygate.wait=true. Now every MR must pass:
| Condition | Threshold |
|---|---|
| Coverage on new code | >= 85% (CI-enforced, above SonarQube’s 80% default) |
| Duplicated lines | <= 3% |
| Security hotspots reviewed | 100% |
| New violations | 0 |
But first we had to fix the 31 existing violations. Some were real issues:
A CRITICAL vulnerability: our JWT decoding called jwt.get_unverified_header(token) to read the algorithm before verification. An attacker could forge a header with alg: "none" to bypass signature checks. The fix: try HS256 first, catch DecodeError, then fall back to asymmetric algorithms. This eliminates the unverified header read entirely.
# Before: reads header WITHOUT verifying signature
header = jwt.get_unverified_header(token)  # VULNERABILITY
alg = header.get("alg", "HS256")

# After: tries verified decode, falls back safely
try:
    return jwt.decode(token, secret, algorithms=["HS256"], audience="authenticated")
except (jwt.InvalidAlgorithmError, jwt.DecodeError):
    signing_key = jwks_client.get_signing_key_from_jwt(token)
    return jwt.decode(token, signing_key.key, algorithms=["ES256", "ES384", "ES512"], ...)
Others were code quality improvements: extracting duplicated string literals to constants, memoizing React context values with useMemo to prevent unnecessary re-renders, merging duplicate CSS :root selectors, and adding Readonly<> to component props across 8 files.
After fixing all violations and marking the one security hotspot as reviewed, the quality gate passed: 0 violations, 100% hotspots reviewed, 87.5% coverage.
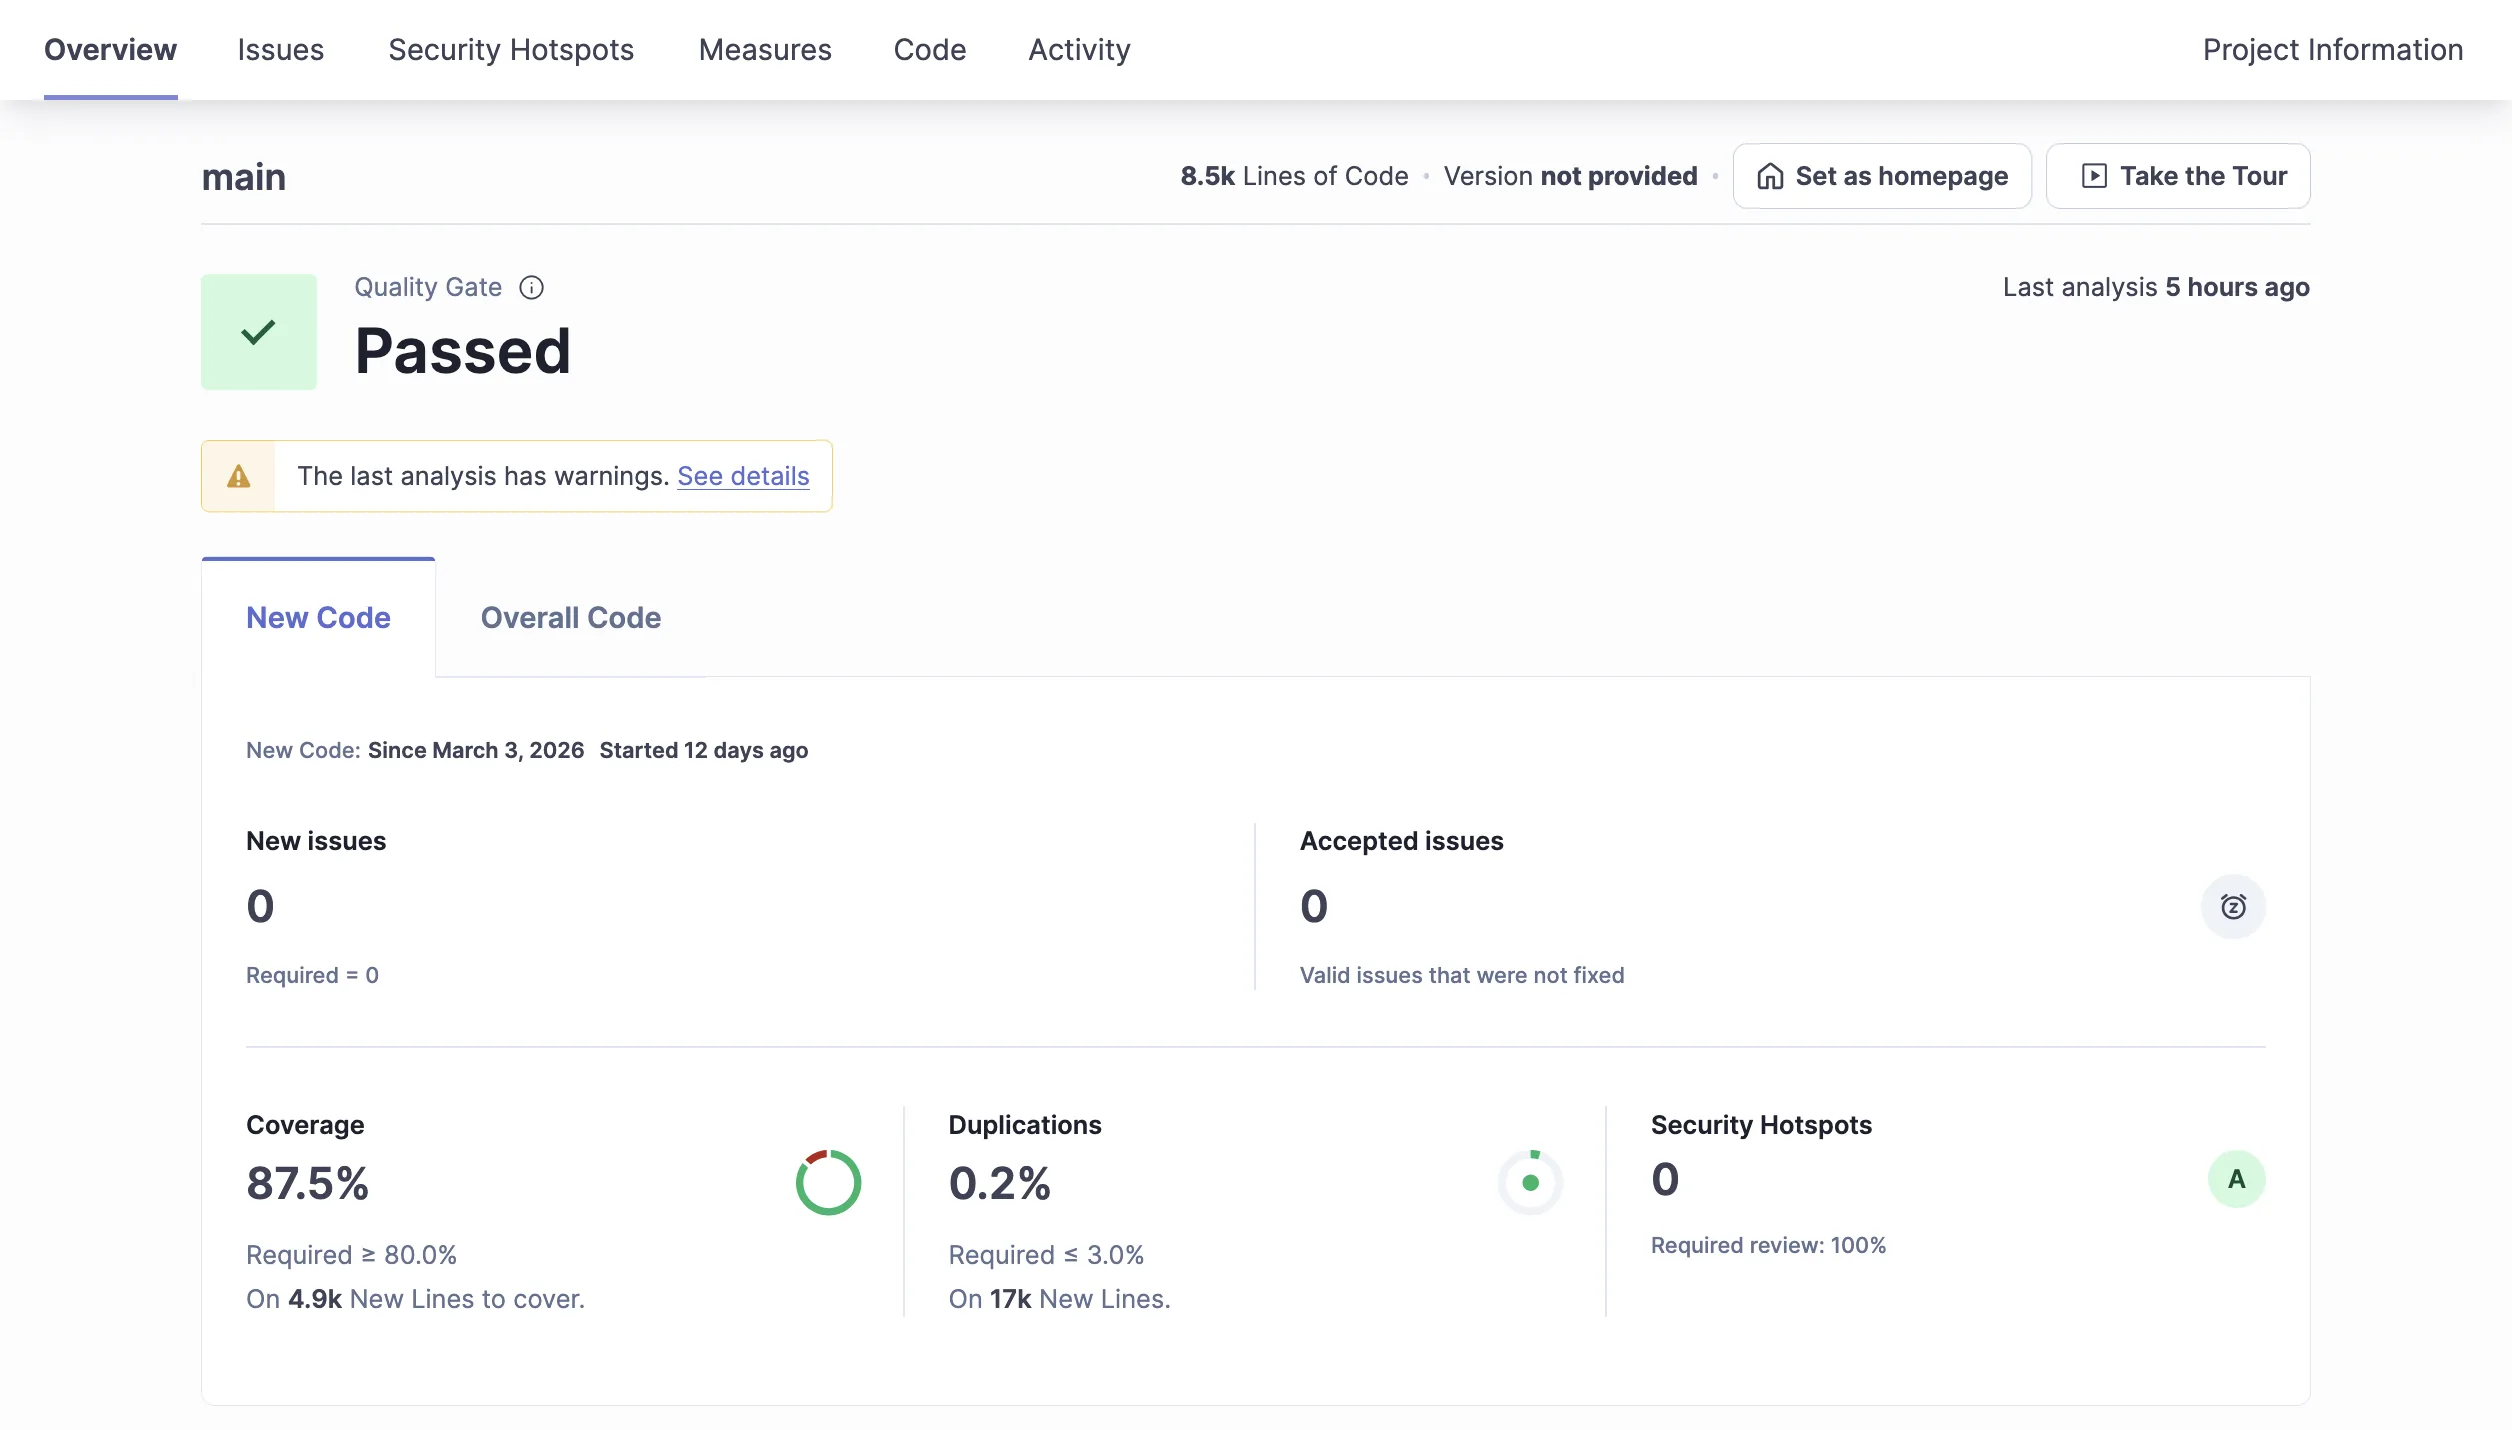
Quality gate: passed. 87.5% coverage, 0 new issues, 0 security hotspots.
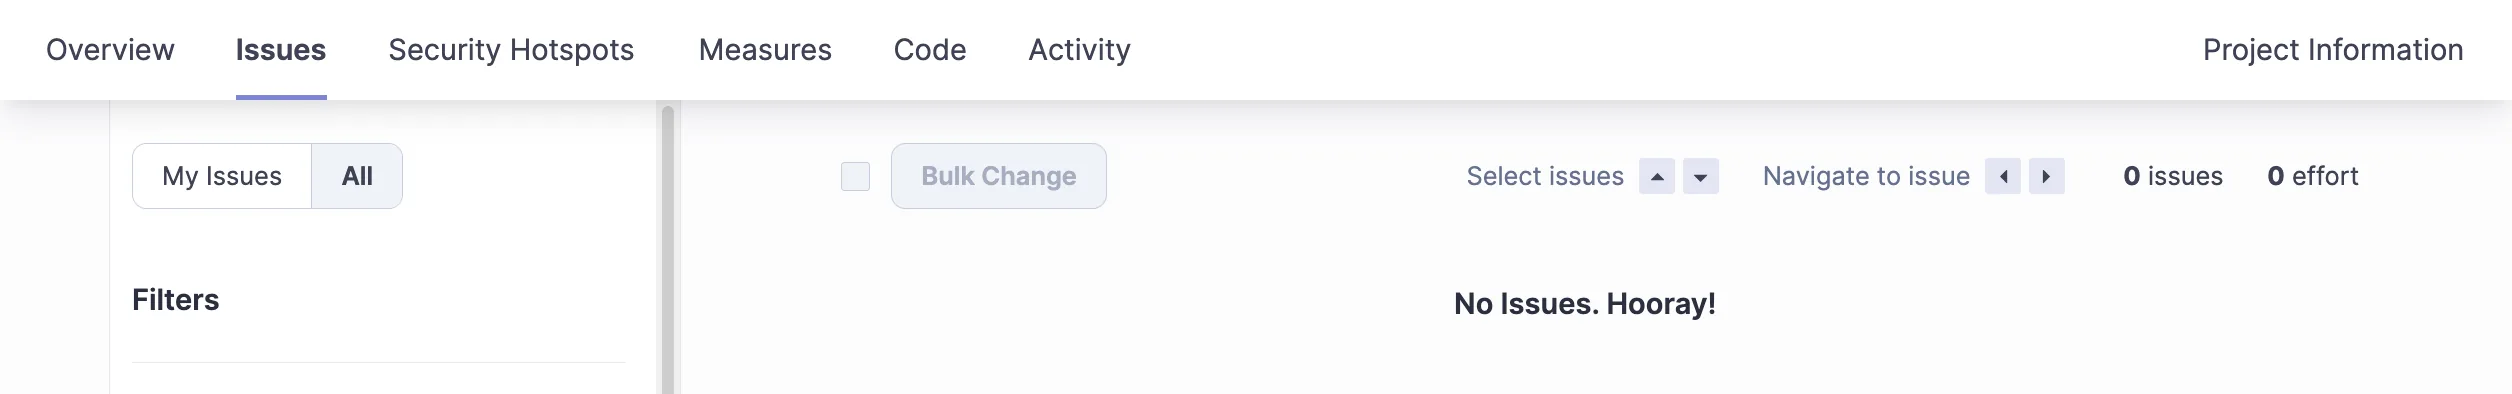
31 violations resolved, zero remaining.
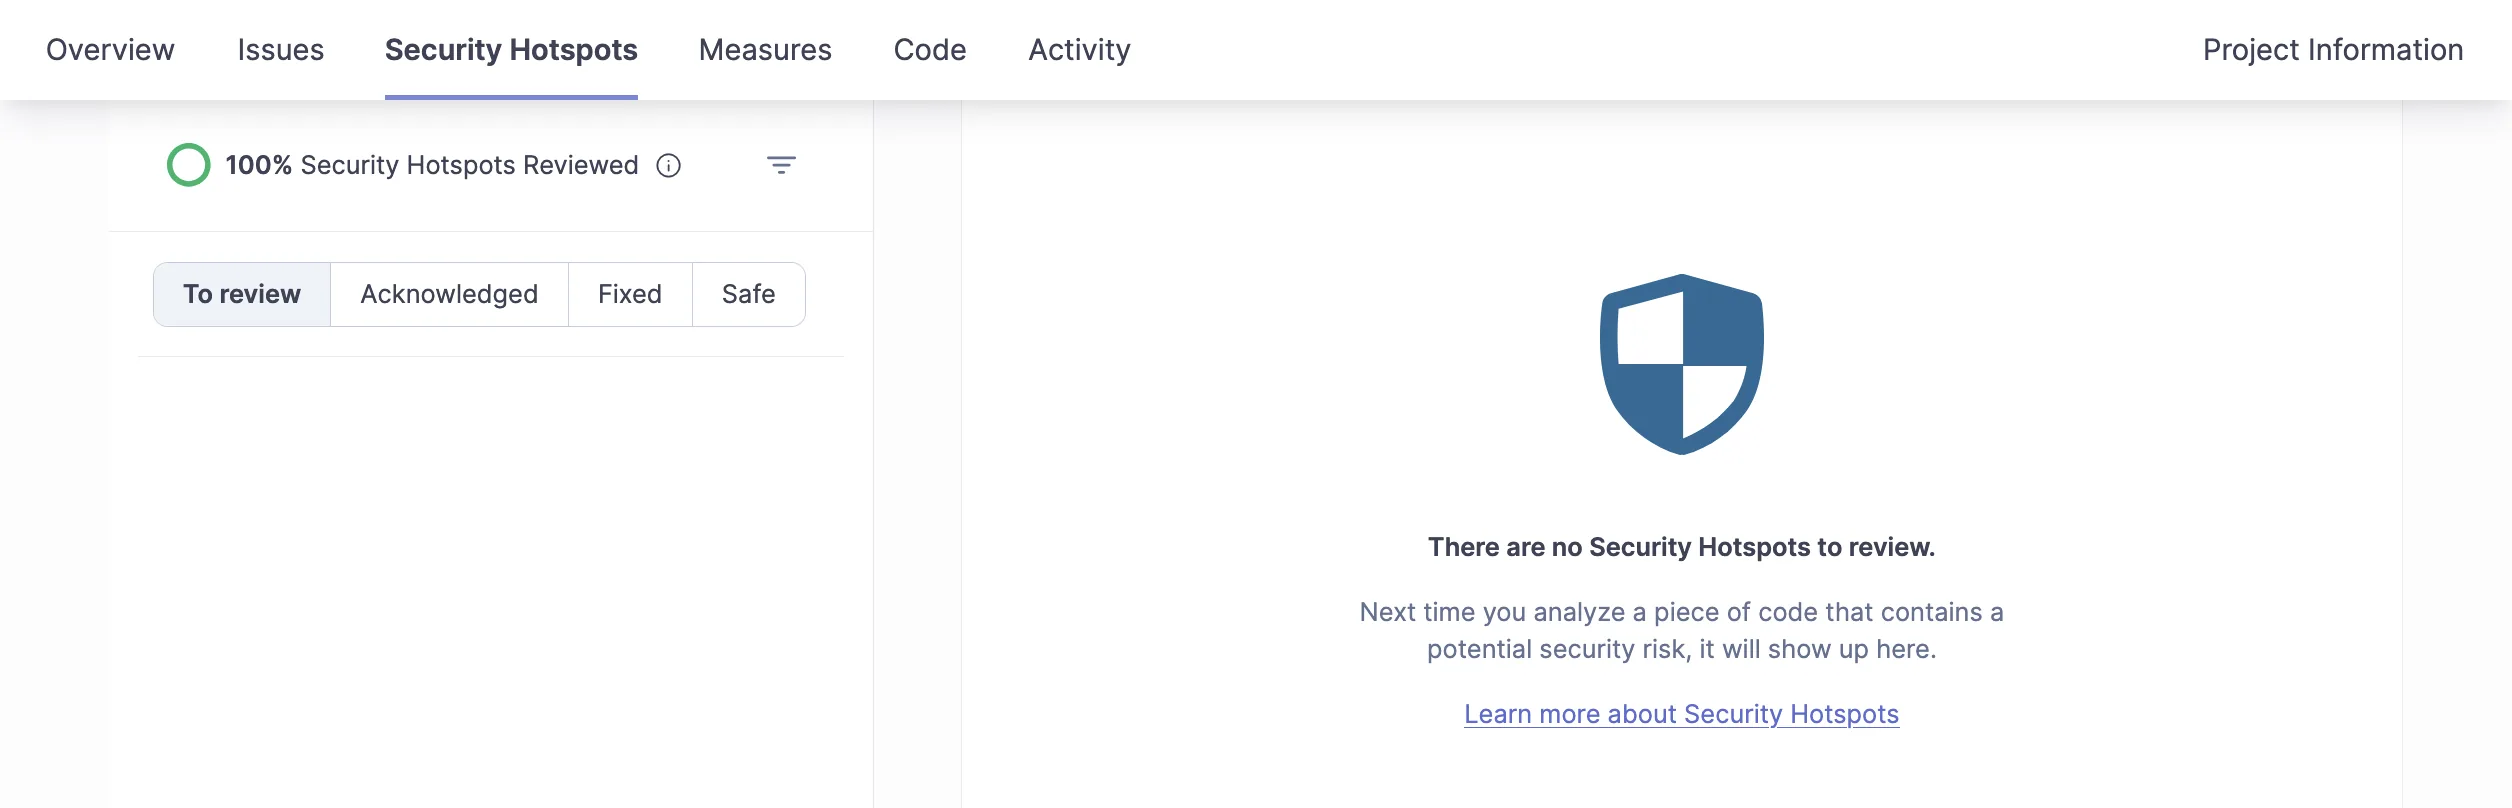
All security hotspots reviewed and resolved.
Quality Gates Keep Catching Things
Making the quality gate blocking was not a one-time event. Every new feature had to pass the same bar, and the gate kept finding real issues.
When we added an email template service (Jinja2 rendering for reminder emails), SonarQube flagged insufficient coverage on the new code. The service had CRUD operations, template rendering, and context variable injection, but only the happy path was tested. We added 12 tests covering edge cases: rendering with missing variables, invalid template syntax, empty templates, and concurrent template updates. Coverage on the new code went from 62% to 94%.
SonarQube also caught a duplicated string literal ("Database connection required") used across multiple service methods. Small thing, but it is exactly the kind of tech debt that compounds. We extracted it to a _DB_REQUIRED constant.
Bandit (our Python SAST tool) flagged a false positive: B704 on Markup() from Jinja2. Bandit warns that Markup() can introduce XSS if the input is user-controlled. In our case, the input comes from sandboxed Jinja2 templates that we control, not from user input. We suppressed it with # nosec B704 and a comment explaining why, rather than disabling the rule globally. The distinction matters: suppressing a specific instance with justification is security-aware; disabling the rule entirely is security-negligent.
Email HTML templates (the <table> layout required for email client compatibility) had to be excluded from SonarQube analysis entirely. Email HTML is a different universe from web HTML: inline styles, table-based layout, no CSS grid or flexbox. Applying web code quality rules to email templates would flag every line as a violation. We added apps/api/src/app/templates/** to sonar.exclusions.
These are not dramatic stories. They are the unglamorous reality of quality gates: every new feature triggers a negotiation between the gate’s rules and the code’s context. The value is not in the initial setup; it is in the ongoing discipline of either fixing what the gate finds or explicitly justifying why a suppression is warranted.
Schemathesis: The API Fuzzer That Found a Real Bug
Schemathesis generates random HTTP requests from your OpenAPI schema and fires them at your running API. It is like property-based testing for API contracts.
We added it as a CI job that spins up the FastAPI server, runs Schemathesis against it, and checks for 5xx responses:
api:schema-test:
  script:
    - uv run uvicorn app.main:app --port 9999 &
    - UVICORN_PID=$!
    - # wait for health check ...
    - uv run schemathesis run http://localhost:9999/openapi.json
        --max-examples=20 --checks not_a_server_error
    - kill $UVICORN_PID
  after_script:
    - fuser -k 9999/tcp 2>/dev/null || true
On its first real run, Schemathesis found a production bug: GET /api/clients/ returned HTTP 500 when the encryption key did not match the stored client data. The endpoint tried to decrypt PII fields (email, phone) and crashed with InvalidTag instead of gracefully handling the mismatch. The fix: return "[encrypted]" as a masked value and log the error, instead of crashing the entire endpoint for all users.
This is a bug that no hand-written test would have found because no developer would think to test “what happens when the encryption key changes between encrypt and decrypt?” Schemathesis found it by sending random requests to every endpoint.
Hardening the Fuzzer: Seven Iterations to a Blocking Gate
That initial Schemathesis setup was a starting point, not the final version. Over several weeks, the schema-test CI job went through seven iterations before it was stable enough to block merges. Each iteration was triggered by a real failure, not a theoretical concern.
Iteration 1: Timeout and orphaned processes. The CI job hung indefinitely when Schemathesis hit a slow endpoint. The uvicorn process was not killed on failure, so the next job in the pipeline could not bind port 9999. Fix: explicit fuser -k 9999/tcp cleanup in after_script, plus a 5-minute timeout.
Iteration 2: Every endpoint returned 401. Schemathesis was testing authenticated endpoints without credentials. Every request returned 401 Unauthorized, which passed the not_a_server_error check (401 is not a 5xx). The fuzzer was “passing” while testing nothing. Fix: generate a real JWT in CI using the Supabase JWT secret:
# Generate a test JWT for authenticated endpoint testing
- |
  TOKEN=$(uv run python -c "
  import jwt, time, os
  token = jwt.encode({
      'sub': os.environ['SCHEMA_TEST_AUTH_USER_ID'],
      'email': 'schema-test@sira.internal',
      'exp': int(time.time()) + 3600,
      'aud': 'authenticated',
      'role': 'authenticated',
  }, os.environ['SUPABASE_JWT_SECRET'], algorithm='HS256')
  print(token)
  ")
- uv run schemathesis run http://localhost:9999/openapi.json
    -H "Authorization: Bearer $TOKEN"
    --include-method GET
    --checks not_a_server_error
Iteration 3: POST/PUT/DELETE mutations corrupted test data. Once authenticated, Schemathesis started creating, modifying, and deleting records in the database. Schema fuzzing with write methods is destructive by nature. Fix: --include-method GET restricts the fuzzer to read-only endpoints.
Iteration 4: UUID path parameters returned 500. Path parameters like /api/clients/{client_id} accepted string in the OpenAPI spec. Schemathesis sent random strings like "abc" and "", which crashed the Supabase query with a PostgreSQL error (invalid UUID format). This was a real bug, not a testing artifact. Fix: change all path parameters from str to UUID in FastAPI, so invalid IDs return 422 (validation error) instead of 500:
# Before: any string accepted, crashes on non-UUID
@router.get("/{client_id}")
async def get_client(client_id: str, ...):

# After: FastAPI validates UUID format, returns 422 for invalid IDs
@router.get("/{client_id}")
async def get_client(client_id: UUID, ...):
This change touched every router (clients, invoices, staff, settings) and their corresponding test fixtures. Schemathesis found this across all four resource types simultaneously.
Iteration 5: Rate limiting blocked the fuzzer. Our API has rate limiting middleware. Schemathesis fires 20+ requests per endpoint in rapid succession, hitting the limit and getting 429s. Fix: disable rate limiting when ENVIRONMENT=test, and exempt /api/health from rate limiting entirely.
Iteration 6: Missing table in schema test environment. After adding a new user_sessions table, the schema-test environment (which connects to a shared database) did not have the table yet. Schemathesis hit the sessions endpoint and got 500. Fix: graceful handling of missing tables with a fallback empty response instead of a crash.
Iteration 7: Blocking enforcement. After all the above were fixed, the job was stable enough to make blocking. Removed allow_failure: true from the CI config. Now every MR must pass schema fuzzing before merge.
Here is the before and after. The first image shows Schemathesis finding a real 500 on GET /api/invoices/overdue and flagging schema validation mismatches on three endpoints that accept {client_id}, {invoice_id}, and {payment_id} as path parameters:
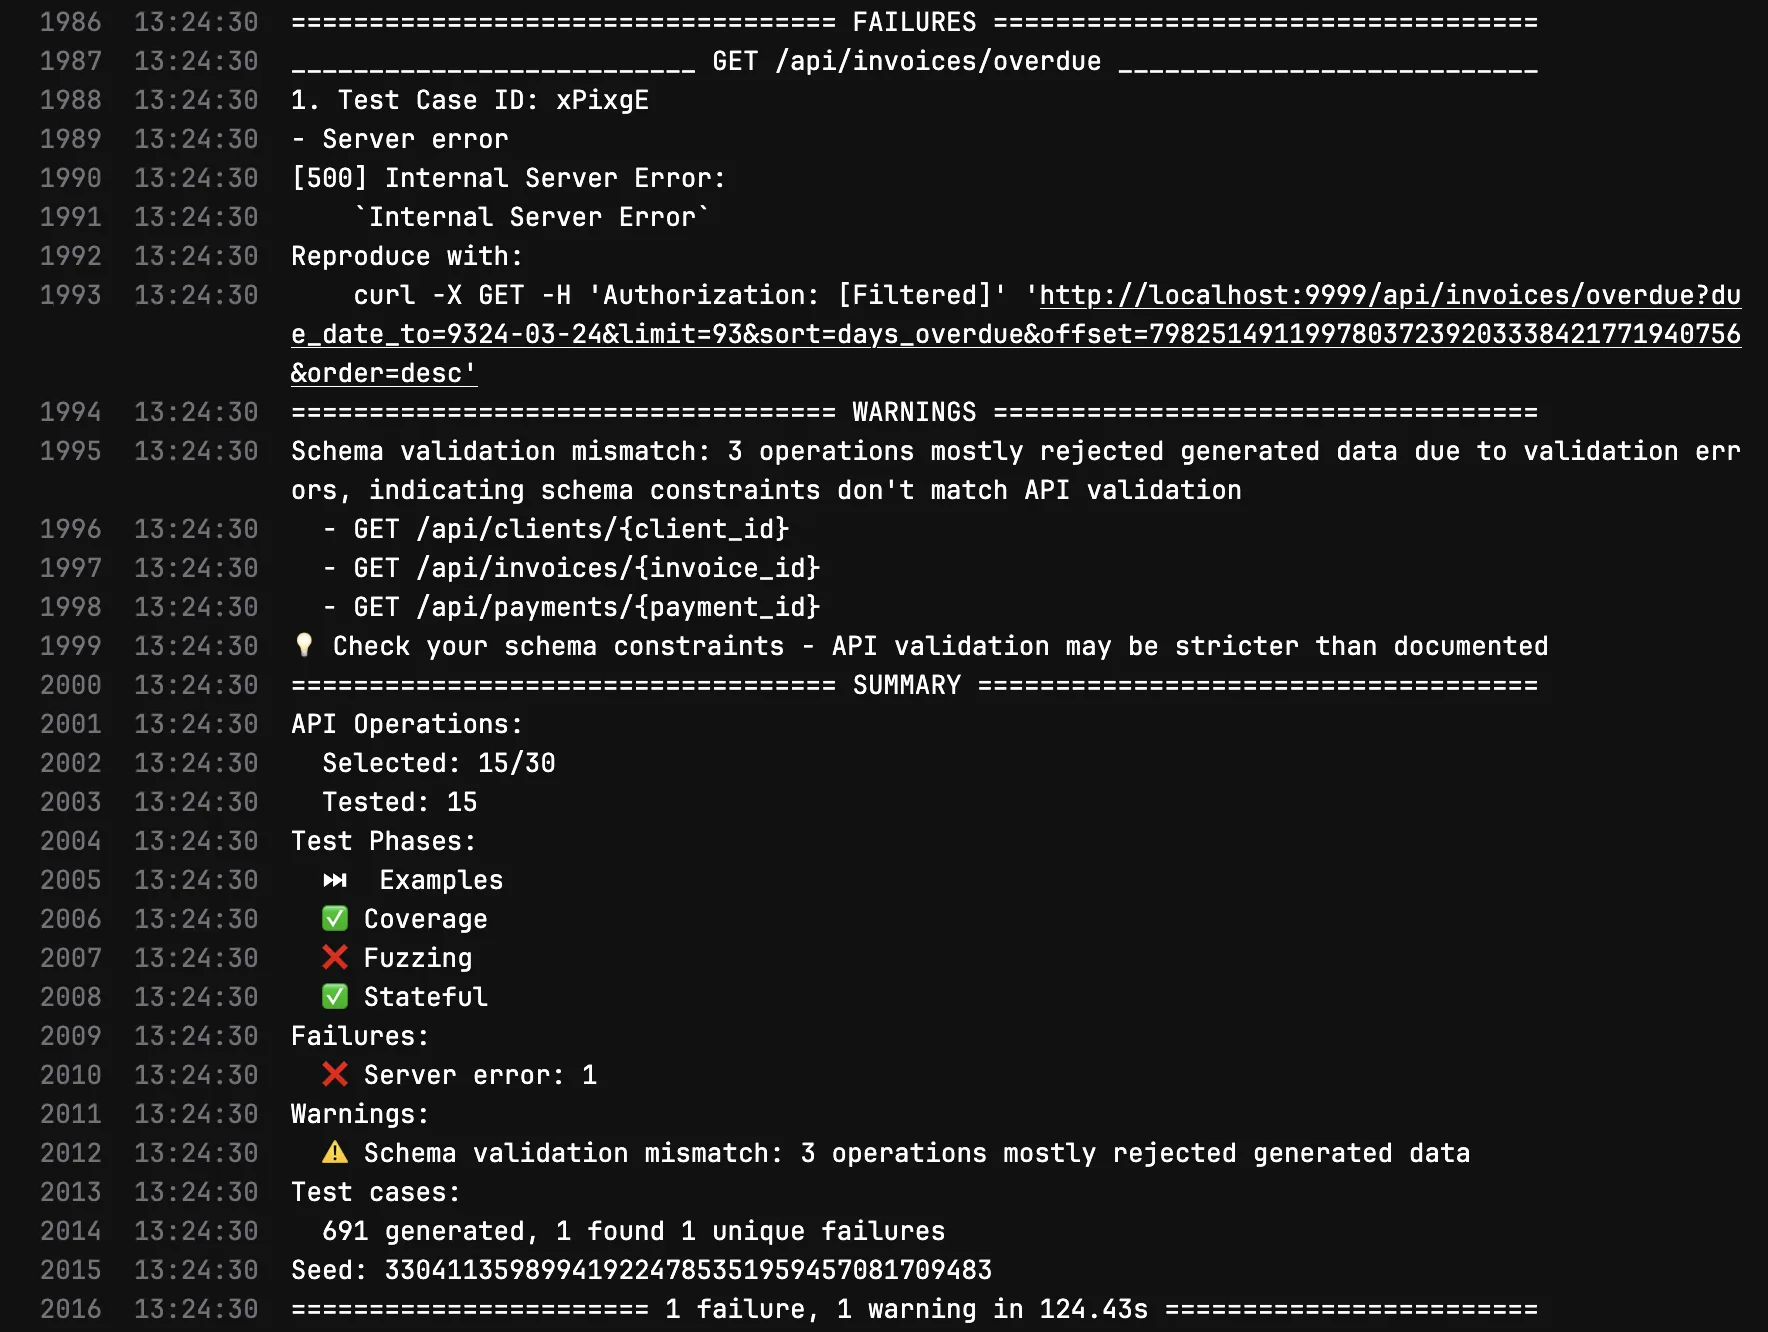
Before: 1 failure (500 Internal Server Error on /api/invoices/overdue), 691 test cases generated, schema validation mismatches on 3 endpoints.
After fixing UUID validation, rate limiting, auth, and GET-only scoping:
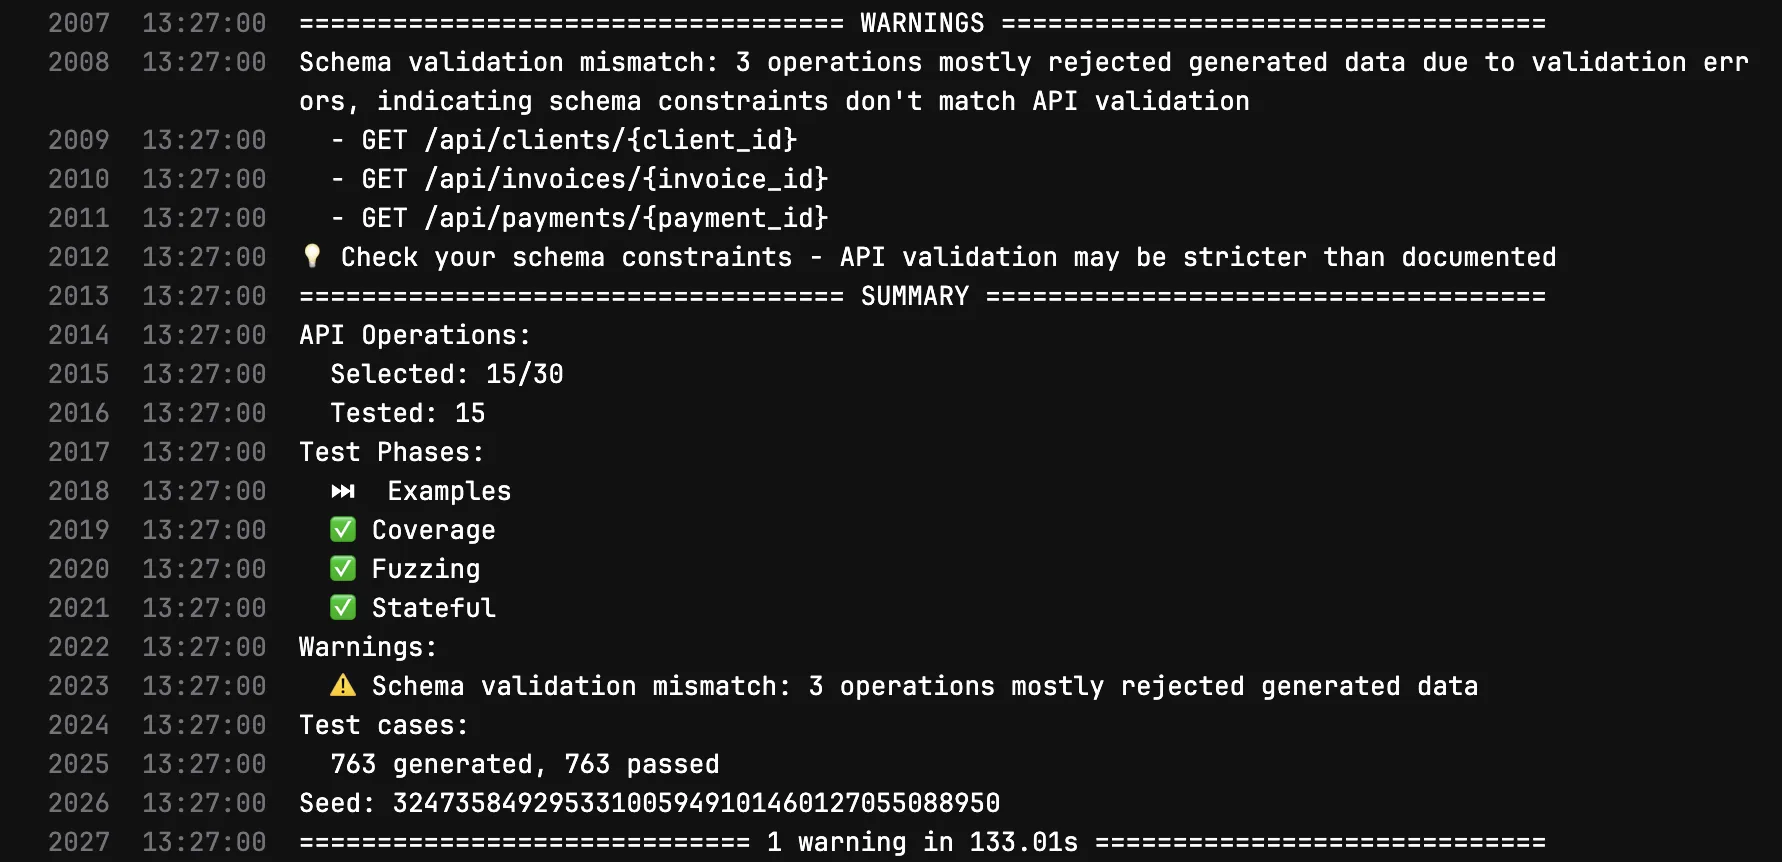
After: 763 test cases generated, 763 passed, 0 failures. Only informational schema validation warnings remain.
The key insight: you cannot make a quality gate blocking on day one. It took seven iterations of fixing false positives, environment issues, and real bugs before the gate was stable enough to trust. Each iteration made the gate more valuable because it eliminated a class of noise while preserving signal.
Load Testing in CI
Performance regressions are invisible until they hit production. We added k6 as an enforced CI job (no allow_failure) that ramps up to 50 virtual users and checks that p95 latency stays under 500ms:
export const options = {
  stages: [
    { duration: '10s', target: 10 },
    { duration: '20s', target: 50 },
    { duration: '10s', target: 0 },
  ],
  thresholds: {
    http_req_duration: ['p(95)<500'],
  },
}
This runs on every MR. If a code change pushes the health endpoint above 500ms under load, the pipeline blocks. It is a crude gate (we are testing against a CI server, not production hardware), but it catches the obvious regressions: accidental N+1 queries, blocking I/O in async handlers, or middleware that adds per-request overhead.
Making Quality Visible: Automated CI Reporting
All these testing layers are useless if reviewers have to dig through CI logs to see the results. We built ci-report.sh, a shared bash script (450+ lines, 8 subcommands) that posts formatted markdown comments on every MR with results from each CI job: test counts, coverage percentage, build sizes, security audit results, BDD scenario pass/fail, and SonarQube quality gate status. A dedicated bot account (@sirabot) posts the comments so it is immediately clear which feedback is automated vs human.
The Design: Green Collapses, Red Expands
The key UX decision was status-based collapsible comments. When a job passes, the comment is collapsed into a single summary line using HTML <details>/<summary>. When something fails or warns, the comment expands to show the full diagnostic table. This keeps MR comment sections clean (no noise from passing jobs) while making failures impossible to miss.
# Each parser determines its own status
local is_green=true
[ -n "$failed" ] && [ "$failed" != "0" ] && is_green=false

# Status emoji: 🟢 green, 🟡 yellow (warnings), 🔴 red (failures)
local status_icon="🟢"
[ "$is_green" = false ] && status_icon="🔴"

if [ "$is_green" = true ]; then
  # Collapsed: one-liner summary, expandable on click
  echo "<details>"
  echo "<summary>${status_icon} <b>API Tests</b> — 554 passed, 91% coverage</summary>"
  echo "$table"
  echo "</details>"
else
  # Expanded: full table visible, reviewer can't miss it
  echo "${status_icon} <b>API Tests</b> — 550 passed, 4 failed"
  echo "$table"
fi
We went through three design iterations before landing on this pattern. The first version posted one comment per job (5 to 8 separate comments per MR). Reviewers said it was too noisy. The second version consolidated everything into a single comment, but that meant waiting for the slowest job to finish before posting anything, delaying feedback. The final version returned to per-job comments but with collapsing, giving fast feedback with minimal noise.
Parsing CI Output is Harder Than It Looks
Each CI tool outputs results in a different format. pytest prints 554 passed, 2 warnings in 41.72s. vitest prints Tests 344 passed (344) with multiple spaces for alignment. Vite build output uses unicode │ (U+2502) separators. Schemathesis changed its output format between v3 and v4. Each parser needed its own regex.
The worst bug was invisible for a full CI run: tee captures raw terminal output including ANSI escape codes (\e[32m for green text, \e[0m for reset). What looks like dist/index.html in the terminal is actually \e[2mdist/\e[22m\e[32mindex.html\e[39m in the captured file. Every regex silently failed until we added a strip_ansi() function:
strip_ansi() {
  sed 's/\x1b\[[0-9;]*[a-zA-Z]//g' "$1"
}
This is a transferable lesson: if you are piping CI tool output through tee for post-processing, always strip ANSI codes before parsing. The terminal renders them invisibly, but they break every regex and string match.
SonarQube Quality Gate Reporting
SonarQube already ran in CI and enforced our 85% coverage threshold. But reviewers had to navigate to the SonarQube dashboard to see the full quality gate status. We added automated MR comments that parse the quality gate API response and post a table with every metric, its value, the threshold, and pass/fail status.
The implementation revealed an access limitation: the SonarQube measures/component API (which returns overall project coverage) requires “Browse” permission that our CI token does not have. Instead of requesting elevated permissions, we fetch both the PR quality gate (which only shows conditions relevant to changed code) and the main branch quality gate (which has all conditions including coverage), then merge them. PR conditions take priority; main branch fills the gaps:
# Merge PR and main branch quality gate conditions
pr_keys = {c['metricKey'] for c in pr_conditions}
conditions = list(pr_conditions)
for c in main_conditions:
    if c['metricKey'] not in pr_keys:
        c['_from_main'] = True  # Label as informational
        conditions.append(c)
Pipeline Status Granularity
GitLab CI jobs traditionally show binary green/red. We added a third state using allow_failure: exit_codes: [77], which makes exit code 77 show as yellow/orange (warning) while exit 1 stays red (failure). This maps semantic meaning to pipeline colors:
| Exit Code | Pipeline Color | Meaning |
|---|---|---|
| 0 | 🟢 Green | Clean pass |
| 77 | 🟡 Yellow | Passed with warnings (non-blocking) |
| 1 | 🔴 Red | Failed (blocks merge) |
The security:sast job uses this to distinguish severity: moderate npm vulnerabilities get yellow (you should know, but it will not block you), while critical/high get red (fix before merging). The implementation parses pnpm audit --json output with Python to count vulnerabilities by severity:
CRITICAL=$(echo "$AUDIT_OUTPUT" | python3 -c "
  import json, sys
  d = json.load(sys.stdin)
  print(sum(1 for v in d.get('advisories',{}).values()
            if v.get('severity')=='critical'))
" 2>/dev/null || echo 0)

if [ "$CRITICAL" -gt 0 ] || [ "$HIGH" -gt 0 ]; then
  exit 1   # Red: block the merge
elif [ "$MODERATE" -gt 0 ]; then
  exit 77  # Yellow: warning, don't block
fi
This granularity means reviewers see meaningful pipeline colors instead of “everything is green because we set allow_failure: true everywhere.”
Staging Supabase for Schema Testing
Schema tests against production Supabase meant every feature branch with a new migration would fail, because the migration had not been applied to prod yet. The allow_failure: true band-aid hid this by making all failures yellow, including real API bugs.
We created a dedicated free-tier staging Supabase project. Before each schema-test run, the CI job performs a full database reset:
# 1. Drop and recreate the public schema
psql -c "DROP SCHEMA IF EXISTS public CASCADE; CREATE SCHEMA public;"

# 2. Set default privileges BEFORE migrations (so tables inherit grants)
psql -c "ALTER DEFAULT PRIVILEGES FOR ROLE postgres IN SCHEMA public
         GRANT ALL ON TABLES TO anon, authenticated, service_role;"

# 3. Apply ALL migrations (including the branch's new ones)
for f in $(ls -1 supabase/migrations/*.sql | sort); do
  psql -f "$f" -v ON_ERROR_STOP=1
done

# 4. Seed test data + create auth user for JWT validation
psql -f supabase/seed.sql
psql -c "INSERT INTO auth.users (...) VALUES (...) ON CONFLICT DO NOTHING"
The ALTER DEFAULT PRIVILEGES before migrations is critical. Without it, tables created by migrations inherit no grants, and PostgREST (Supabase’s REST API layer) cannot access them. This was a non-obvious failure mode: the tables existed, the data was seeded, but every API call returned “permission denied for table clients” because the PostgREST roles (anon, authenticated, service_role) had no access.
A resource_group: schema-staging serializes these jobs across all MR pipelines. Without it, two concurrent pipelines could corrupt each other’s staging database (one resets while the other is mid-test). GitLab’s resource group acts as a mutex: only one schema-test runs at a time, others queue.
The result: 710 test cases generated, 710 passed, zero server errors. Feature branches with new migrations now pass schema testing for the first time.
Scaling BDD Coverage
The initial 13 BDD scenarios covered 3 domains (invoice creation, overdue detection, payment recording). We analyzed the full application and found 7 uncovered domains:
| Domain | Endpoints | BDD Scenarios |
|---|---|---|
| Invoices | 8 | 4 (creation only) |
| Overdue Detection | (worker) | 5 |
| Payments | 4 | 4 |
| Clients | 5 | 0 |
| Risk Scoring | 1 | 0 |
| Reminders | 2 | 0 |
| Auth/Sessions | 5 | 0 |
| Settings/Templates | 4 | 0 |
We created 8 tickets with detailed Gherkin scenario lists (39 new scenarios total), distributed as subtasks under the relevant PBIs for team members to implement. A dedicated api:bdd CI job now runs BDD tests separately and posts a per-feature pass/fail table on each MR, making behavioral test coverage visible to every reviewer.
What I Learned
Enforcement beats advisory, but enforcement takes iteration. SonarQube was analyzing our code for weeks with allow_failure: true. Nobody looked at the results. The moment we made it blocking, we fixed 31 violations in one day. But “make it blocking” is not a switch you flip once. Our schema-test job went through seven iterations before it was stable enough to enforce. Each iteration removed a class of false positives while preserving the real signal. The patience to iterate on a quality gate, rather than giving up after the first false positive, is what separates teams that enforce quality from teams that measure it.
The tools that found real bugs were not the ones we expected. We expected SonarQube to find code smells. It found a JWT vulnerability. We expected k6 to find performance issues. It confirmed our latency was fine. The tool that found the most impactful bug was Schemathesis (API fuzzing), which discovered a production crash we never would have tested for manually. And pytest-randomly, which does nothing but shuffle test order, found a real test pollution bug on its first run. The lesson: deploy a diverse set of quality tools, because you cannot predict which one will catch the bug that matters.