~/abhipraya
PPL: Self-Hosted Error Monitoring with Custom Instrumentation
Error monitoring is one of those things that feels optional until the first production bug slips through unnoticed. A user reports “the page is broken,” you check the server, everything looks fine, and three hours later you discover a background task has been silently failing since the last deploy. This blog covers how we built monitoring that catches those failures before users do, what it has actually caught for us, and the configuration knobs you can turn when adopting this for your own project.
Note: Our project is hosted on an internal GitLab instance, so we use the term MR (Merge Request) throughout this blog. If you’re coming from GitHub, MRs are the equivalent of Pull Requests (PRs).
Real-World Value: What This Monitoring Actually Caught
Before diving into architecture, here is the concrete value we have gotten from running this. A snapshot of our production GlitchTip instance right now shows 14 issues captured across the two projects (sira-api and sira-web):
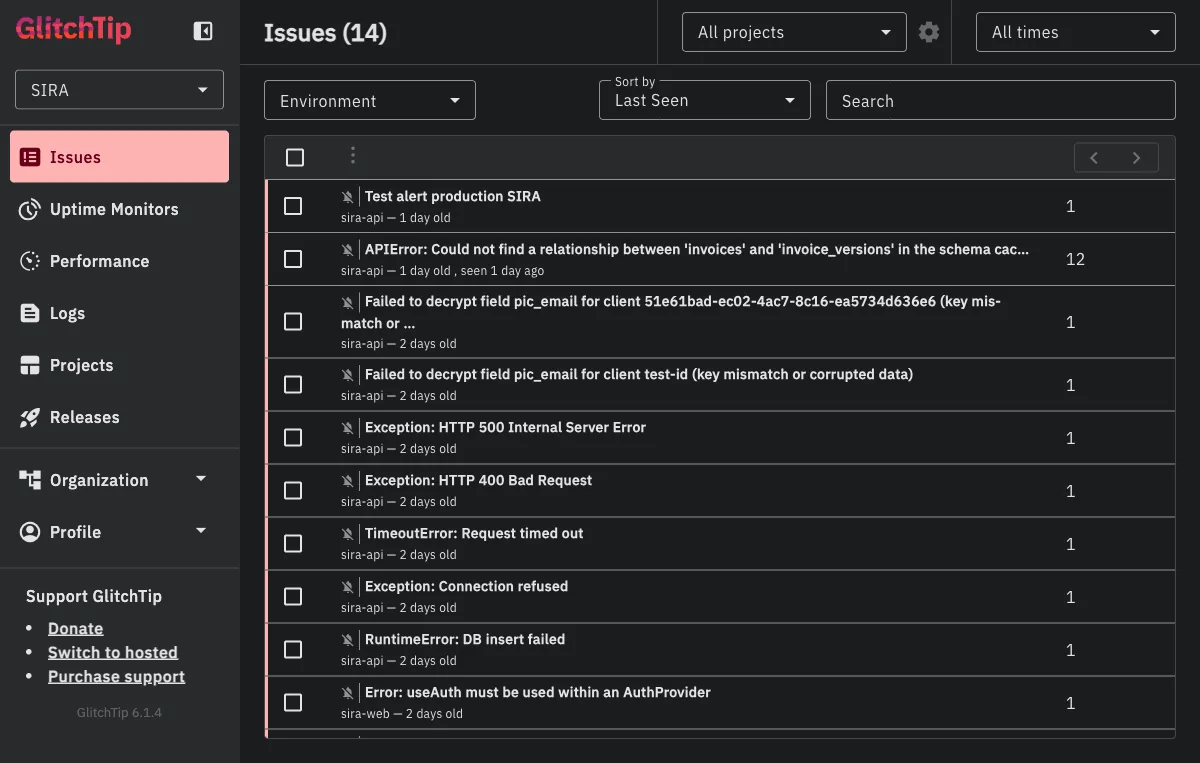
Four of these illustrate the kinds of bugs monitoring catches that would otherwise reach users first:
KeyError: 'app.workers.check_overdue.check_overdue_invoices'(2 months old, now resolved). Our Celery beat scheduler was trying to dispatch a task that wasn’t registered with the worker. Without monitoring, the daily overdue-invoice scan would have silently never run, and our first indication would have been users reporting “why didn’t I get a reminder yesterday?” Instead, the alert email hit the team inbox within seconds of the scheduler’s first failed dispatch. See the section “The Alert Email” below for what that email looked like.APIError: Could not find a relationship between 'invoices' and 'invoice_versions' in the schema cache(12 events, 1 day old). PostgREST caches the database schema and did not pick up a new foreign key relationship after a migration. Twelve list-invoices requests failed before the dev noticed and issued aNOTIFY pgrst, 'reload schema';. The monitoring dashboard showed the exact file and line (app/db/queries/invoices.py:92) AND PostgREST’s own hint for the fix (more on this in the case study below).Failed to decrypt field pic_email for client ... (key mismatch or corrupted data)(2 distinct events). An encryption key rotation was incomplete: one environment had the new key, another still had the old. The monitoring caught the decryption failure at the exact point the record was being read, with the client ID embedded in the error message for immediate triage.Error: useAuth must be used within an AuthProvider(sira-web, 2 events). A React context error that would have produced a blank white screen for the user. The frontend error boundary caught it, showed a fallback UI, and reported the component stack trace so we could find the component tree that was rendering outside the provider.
The common thread: every one of these would have either reached users silently or taken substantially longer to diagnose without captured context (stack traces, component trees, PostgREST hints, client IDs). Monitoring turned “something is broken somewhere” into “here is the exact line, here is the user who hit it, here is what the database was telling us.”
The Alert Email That Actually Reached Our Inbox
When the check_overdue KeyError fired, this is what hit our Gmail within seconds:
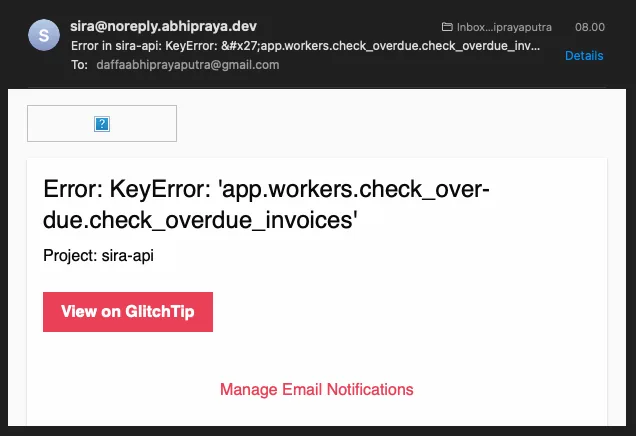
The email itself is spartan on purpose: a one-line summary of the exception, the project name (sira-api), a “View on GlitchTip” button that deep-links to the issue detail page, and a “Manage Email Notifications” footer for recipients who want to tune the noise. The sender address is sira@noreply.abhipraya.dev because GlitchTip is wired into the same Resend SMTP relay the main application uses (no separate mail provider).
In practice, the three pieces of information on this email are exactly what the on-call developer needs to decide whether to keep working or to open the dashboard: the error type, the project, and a one-click path to the full stack trace. Anything more would be noise.
Case Study: From Alert to Fix in Under a Minute
To show the end-to-end flow, here is the most recent high-event issue from our production dashboard. A developer opened an MR that added a foreign key between invoices and invoice_versions. After deploying to their dev environment, any request that hit GET /api/invoices returned a 400. Twelve of these errors landed in GlitchTip within two minutes.
Clicking into the issue shows the full event:
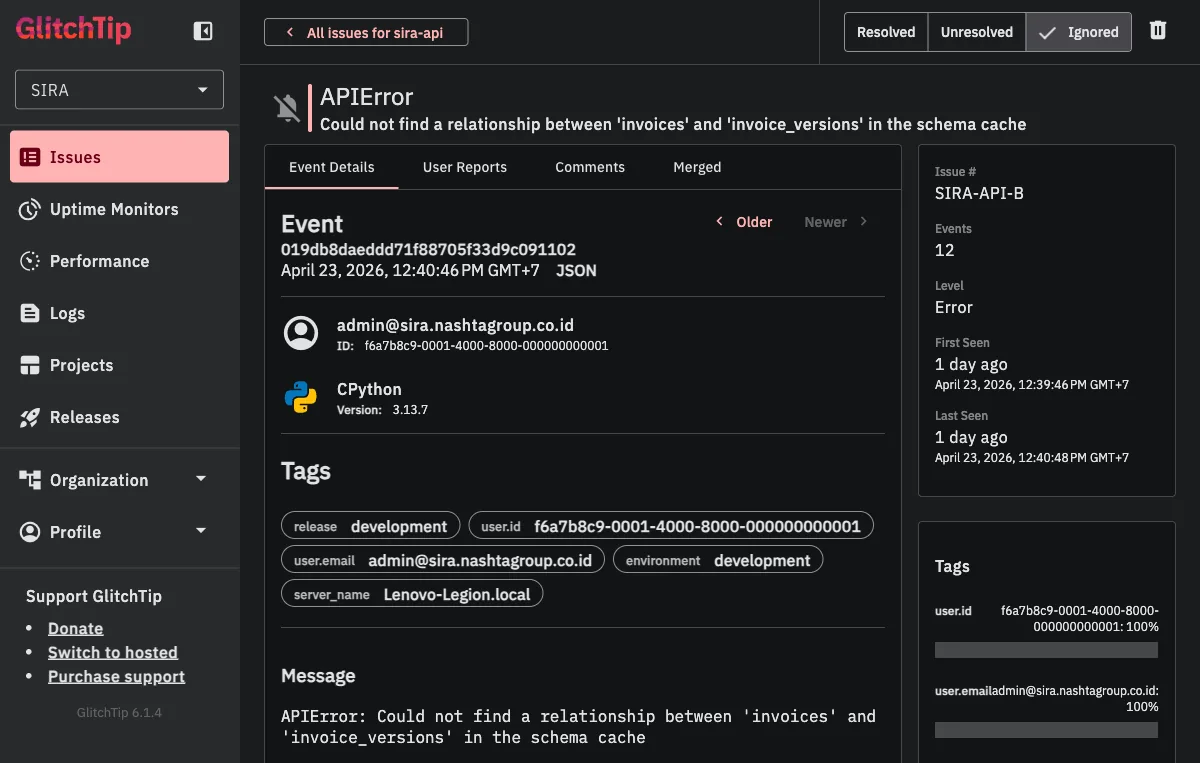
The event page tells us exactly what we need on first glance:
- Event count: 12 occurrences (this is a real pattern, not a fluke)
- First seen / last seen: both “1 day ago” within a 2-minute window (the errors happened in a tight burst, suggesting a deploy-triggered regression)
- User context:
admin@sira.nashtagroup.co.id(the developer testing their MR, not a real customer yet, good) - Environment:
development(caught before it reached production, better) - Tags: release SHA, server name, environment, user ID (all automatic, all searchable for future errors)
Scrolling down to the stack trace closes the loop:
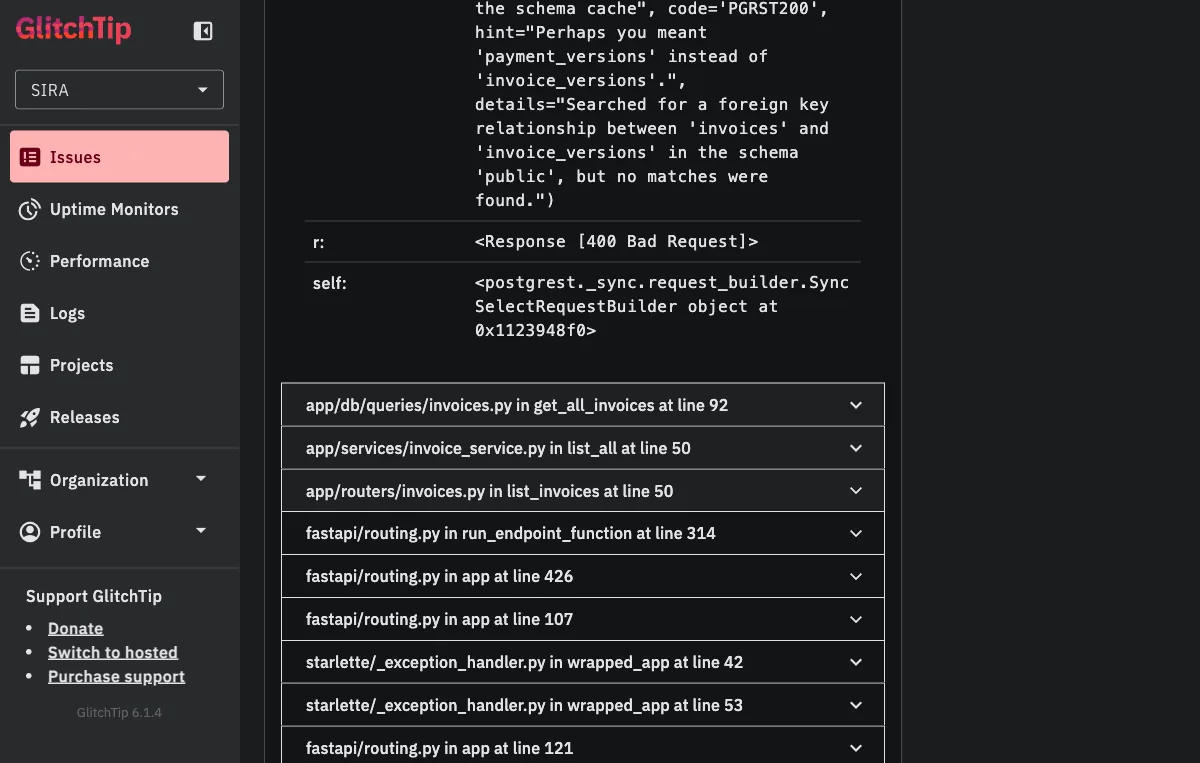
Two things are worth noting here.
First, PostgREST’s own error message tells us the fix: hint="Perhaps you meant 'payment_versions' instead of 'invoice_versions'." The schema cache has payment_versions but not invoice_versions, which means the PostgREST daemon has an older view of the schema than the database does. The standard fix is to issue NOTIFY pgrst, 'reload schema'; to force a cache refresh.
Second, the stack trace ends in our code, not in a vendored library: app/db/queries/invoices.py in get_all_invoices at line 92 → app/services/invoice_service.py in list_all at line 50 → app/routers/invoices.py in list_invoices at line 50. From the alert email, to clicking “View on GlitchTip,” to reading this stack trace, a developer gets from “something is wrong” to “I know the exact line and the exact fix” in well under a minute.
That is the real-world value. Not just “errors are captured” but “errors are turned into actionable, self-documenting artifacts that cut the mean time to resolution from hours to minutes.”
Why Self-Hosted Monitoring
Sentry is the industry standard for error tracking. It captures unhandled exceptions, attaches request context (method, path, status code), and groups similar errors into issues. The free tier works for solo developers, but it caps you at one team member.
In a university team of five engineers who all need access to error dashboards for individual assessment, that is a non-starter. We evaluated three options:
| Option | Cost | Multi-user | SDK Compatible | Self-Hosted |
|---|---|---|---|---|
| Sentry Cloud (Team) | Paid | Yes | Native | No |
| GlitchTip | Free | Yes | Sentry SDK | Yes |
| Highlight.io | Free tier | Yes | Own SDK | Optional |
We chose GlitchTip because it is Sentry SDK-compatible. The same sentry-sdk Python package and @sentry/react JavaScript package work identically against both Sentry Cloud and GlitchTip. The only thing that changes is the DSN (Data Source Name) URL. This means zero code migration: swap the DSN, and every error, performance trace, and release tag flows to the self-hosted instance instead of Sentry Cloud.
The GlitchTip Stack
GlitchTip runs as three Docker containers alongside the main application:
glitchtip-postgres:
  image: postgres:15-alpine
  volumes:
    - glitchtip_postgres_data:/var/lib/postgresql/data

glitchtip-web:
  image: glitchtip/glitchtip:latest
  environment:
    DATABASE_URL: postgres://glitchtip:${GLITCHTIP_DB_PASSWORD}@glitchtip-postgres/glitchtip
    REDIS_URL: redis://redis:6379/1
    EMAIL_URL: ${GLITCHTIP_EMAIL_URL}
    DEFAULT_FROM_EMAIL: sira@noreply.abhipraya.dev

glitchtip-worker:
  image: glitchtip/glitchtip:latest
  command: ./bin/run-celery-with-beat.sh
A few things worth noting:
Separate Postgres instance. GlitchTip gets its own database, not the application’s Supabase. This prevents monitoring data from affecting application queries and lets you back up or wipe monitoring data independently.
Shared Redis. GlitchTip uses Redis database 1 (redis://redis:6379/1), while the application uses database 0. Same Redis container, different logical databases. This saves memory on a constrained VPS.
Email integration. GlitchTip sends alert notifications via the same Resend SMTP relay the application uses. When an error occurs, the alert reaches the team’s inbox within seconds.
Nginx routes sira-glitchtip.nashtagroup.co.id to the GlitchTip web container, giving the team a dedicated dashboard separate from the application.
Configuration Knobs: What You Can Customize
The init block below is the single most important piece of code in this entire blog, because every parameter is a decision you have to make when adopting this for your own project. Here it is, with each knob explained as a decision, not just a setting:
# apps/api/src/app/main.py
if settings.sentry_dsn:
    sentry_sdk.init(
        dsn=settings.sentry_dsn,
        release=settings.commit_sha,
        traces_sample_rate=settings.sentry_traces_sample_rate,
        environment=settings.environment,
        send_default_pii=False,
    )
| Knob | Required? | What it does | When to change it |
|---|---|---|---|
dsn | Yes | Tells the SDK where to send events. This is the Data Source Name URL from your GlitchTip project settings page. | Always required. Read from env var, never hardcode. |
release | Recommended | Tags every event with the deploying commit SHA so you can correlate errors to deploys. | Change the source (settings.commit_sha) if your CI/CD uses a different version scheme (semver tags, build numbers). |
traces_sample_rate | Optional | Fraction of requests for which full performance traces are captured. 1.0 means every request, 0.1 means 10%. | Lower this (0.1 or 0.01) if your traffic is high enough that full sampling is expensive. For a pre-launch app like ours, 1.0 is fine. |
environment | Recommended | Tags every event with development, staging, or production. Lets you filter the dashboard by environment. | Change if you have more environments (e.g., preview, canary). |
send_default_pii | Security-critical | When True, Sentry captures request bodies and headers. In our case, those headers include JWT bearer tokens. We set False to prevent auth tokens leaking into monitoring. | Leave False unless you have a specific reason to log request bodies AND you have no sensitive headers. |
The one knob nobody thinks about first but probably should. send_default_pii=False is the quiet security-critical flag. By default, the SDK captures everything it thinks might help debug, including the Authorization header. Setting it to False preserves the full stack trace and request metadata (method, path, status code, timing) while redacting anything that looks like a credential. This is the default every team should adopt before their first deploy.
The frontend configuration mirrors this same pattern, with browserTracingIntegration() added for page-load and navigation performance:
// apps/web/src/main.tsx
if (import.meta.env.VITE_SENTRY_DSN) {
    Sentry.init({
        dsn: import.meta.env.VITE_SENTRY_DSN,
        release: import.meta.env.VITE_COMMIT_SHA || 'development',
        integrations: [Sentry.browserTracingIntegration()],
        tracesSampleRate: 1.0,
        environment: import.meta.env.MODE,
    })
}
Two things to note: the init is wrapped in a DSN check so the SDK is a complete no-op in development (no network calls, no overhead), and the release tag has a fallback to 'development' so local runs do not show up as undefined in the dashboard.
Custom Performance Spans: Monitoring What Matters
Default Sentry integration captures API request latency (how long each HTTP request takes end-to-end). That is useful but coarse. If a request takes 500ms, you do not know whether the bottleneck is a database query, a computation, or a downstream API call.
Custom performance spans break the request into labeled segments. Each span has an operation type (db.query, db.insert, db.update) and a human-readable name:
# apps/api/src/app/services/payment_service.py
async def create(self, data: PaymentCreate, user_id: str | None = None) -> PaymentResponse | None:
    with sentry_sdk.start_span(op="db.query", name="validate_invoice_and_balance"):
        invoice = await get_invoice_by_id(self.db, data.invoice_id)
        existing_payments = await get_payments_by_invoice(self.db, data.invoice_id)
        # ... balance validation ...

    with sentry_sdk.start_span(op="db.insert", name="create_payment_record"):
        payment = await create_payment_record(self.db, ...)

    with sentry_sdk.start_span(op="db.insert", name="create_payment_version_v1"):
        await create_payment_version(self.db, ...)

    with sentry_sdk.start_span(op="db.update", name="recalculate_invoice_status"):
        await self._recalculate_invoice_status(data.invoice_id)
In GlitchTip’s performance view, a single “create payment” transaction breaks down into four labeled segments. If the validate_invoice_and_balance span takes 300ms while the others take 10ms each, you know exactly where to optimize: the validation query is fetching too much data or missing an index.
The dashboard service uses the same pattern to instrument four parallel database queries:
# apps/api/src/app/services/dashboard_service.py
async def get_dashboard_summary(db: Client) -> DashboardSummaryResponse:
    with sentry_sdk.start_span(op="db.query", name="get_total_invoices_count"):
        total_invoices = await get_total_invoices_count(db)
    with sentry_sdk.start_span(op="db.query", name="get_overdue_count"):
        overdue_count = await get_overdue_count(db)
    with sentry_sdk.start_span(op="db.query", name="get_total_outstanding"):
        total_outstanding = await get_total_outstanding(db)
    with sentry_sdk.start_span(op="db.query", name="get_clients_monitored_count"):
        clients_monitored = await get_clients_monitored_count(db)
Without custom spans, a slow dashboard load would require manual profiling to identify which of four queries is the bottleneck. With spans, the monitoring dashboard shows it immediately.
Performance Dashboard: Real Numbers from Production
The custom span instrumentation above feeds into the Performance view. Here is a snapshot of our production GlitchTip sorted by slowest transaction:
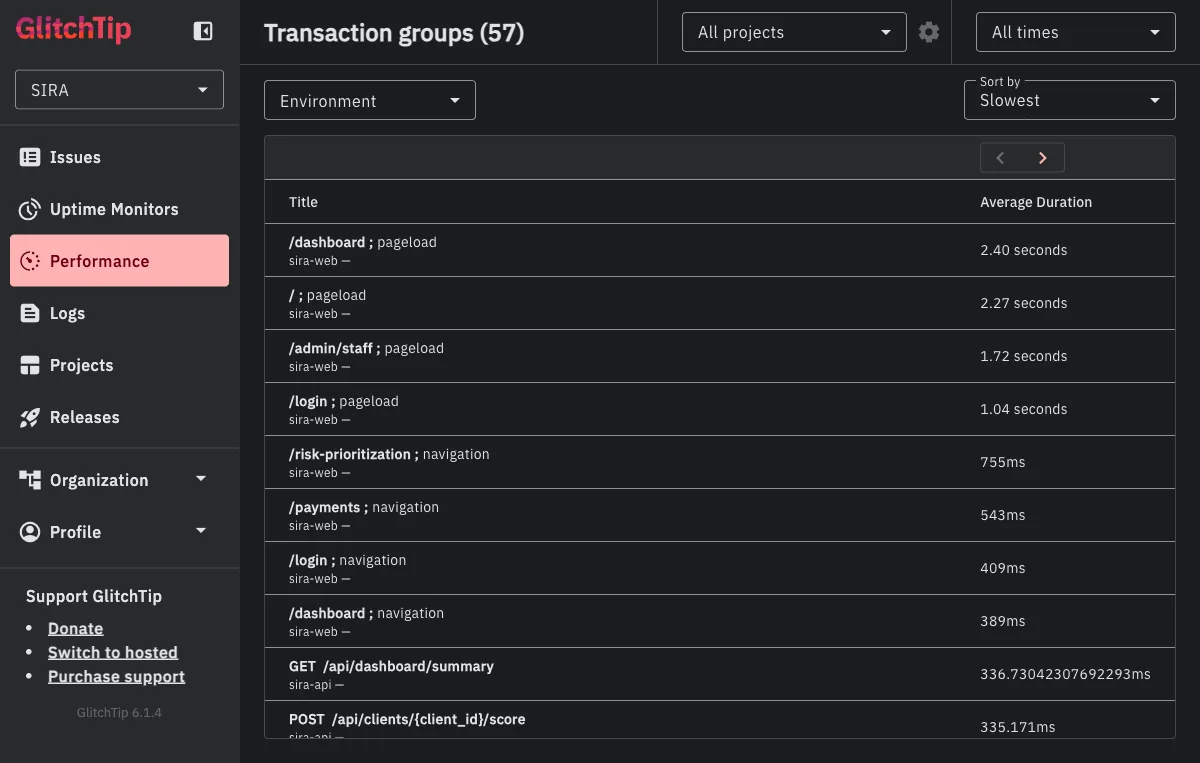
A few things jump out from this view:
- Frontend pageloads dominate the top:
/dashboard,/, and/admin/staffpageloads all sit between 1.7 and 2.4 seconds. These are full React hydration times including API calls fired during mount, so the high numbers are expected but still worth watching. If/dashboardpageload drifts past 3 seconds after a new feature, we know to check which of the parallel dashboard queries got slower. - The
GET /api/dashboard/summaryendpoint shows up at 336ms average across 26 transactions. That is the exact endpoint with four customstart_spancalls shown above, so any regression in the dashboard query layer is directly observable here. POST /api/clients/{client_id}/scoreat 335ms is our risk-scoring endpoint, which runs an ML inference. Monitoring it as a named transaction group lets us catch ML latency regressions without waiting for a user to report “the score button feels slow.”- Celery task transactions (
app.workers.check_overdue.check_overdue_invoices,app.workers.watchdog.watchdog_overdue_check) appear alongside HTTP transactions. Background tasks are often the hardest thing to monitor precisely because they have no HTTP context, but the Celery integration captures their timing and failures as first-class transactions.
This is the kind of dashboard you check once a week to spot trends, not once an hour. The alert email handles the urgent case; this view handles the slow drift.
Celery Worker Monitoring: The Invisible Layer
Background tasks are the hardest thing to monitor. They run in separate processes, have no HTTP request context, and their failures are invisible unless explicitly captured. A Celery task that fails after three retries just stops, and nobody knows until a user reports that their reminder was never sent.
CeleryIntegration
The Celery worker initializes Sentry with an explicit CeleryIntegration():
# apps/api/src/app/workers/celery_app.py
if settings.sentry_dsn:
    sentry_sdk.init(
        dsn=settings.sentry_dsn,
        release=settings.commit_sha,
        traces_sample_rate=settings.sentry_traces_sample_rate,
        environment=settings.environment,
        integrations=[CeleryIntegration()],
    )
The CeleryIntegration is not redundant with Sentry’s auto-discovery. In some SDK versions, Celery exceptions are captured automatically; in others, they are not. Explicitly listing the integration removes version-dependent ambiguity. We wrote a test that verifies the integration is present in the init call, so a future refactor cannot accidentally remove it.
Context Tagging on Worker Tasks
The overdue invoice checker demonstrates context tagging, which attaches structured metadata to error events:
# apps/api/src/app/workers/check_overdue.py
@celery_app.task(bind=True, max_retries=3)
def check_overdue_invoices(self: Task) -> None:
    try:
        db = create_supabase_client()
        start = time.monotonic()
        today_jakarta = datetime.now(_JAKARTA).date()

        with sentry_sdk.start_span(op="db.query", name="mark overdue invoices"):
            updated = mark_invoices_overdue(db, today_jakarta)

        elapsed = time.monotonic() - start
        sentry_sdk.set_context("task_data", {
            "invoices_count": len(updated),
            "task_elapsed_ms": round(elapsed * 1000, 3),
        })
    except Exception as exc:
        sentry_sdk.set_context("task_error", {
            "error_type": type(exc).__name__,
            "error_message": str(exc),
        })
        self.retry(exc=exc, countdown=60)
When this task fails, the GlitchTip error event includes not just the stack trace but also the task_data context: how many invoices were being processed, how long the task had been running before it failed. This turns a generic “database connection error” into “failed after processing 47 invoices in 3.2 seconds,” which immediately narrows the debugging scope.
Watchdog: Recovering from Missed Tasks
The watchdog task runs every 5 minutes and checks whether the daily overdue scan was missed (e.g., because the Beat scheduler was restarted mid-cycle):
# apps/api/src/app/workers/watchdog.py
@celery_app.task
def watchdog_overdue_check() -> None:
    try:
        sentry_sdk.set_context("task_data", {"today_wib": now_jakarta.date().isoformat()})

        if now_jakarta < today_8am:
            sentry_sdk.set_context("task_data", {
                "after_8am": False,
                "recovery_triggered": False,
            })
            return

        if has_overdue:
            celery_app.send_task("app.workers.check_overdue.check_overdue_invoices")
    except Exception as exc:
        sentry_sdk.set_context("task_error", {
            "error_type": type(exc).__name__,
            "error_message": str(exc),
        })
        sentry_sdk.capture_exception(exc)
The watchdog explicitly calls sentry_sdk.capture_exception(exc) because, unlike the overdue checker, it does not retry. A watchdog failure means the recovery mechanism itself is broken, which should be visible immediately in the monitoring dashboard.
Frontend Error Boundary
React applications crash silently by default: a rendering error in one component produces a blank white screen with no feedback. The ErrorBoundary component catches these crashes, shows a user-friendly fallback, and reports the error to Sentry with the component stack trace:
// apps/web/src/components/error-boundary.tsx
export class ErrorBoundary extends Component<ErrorBoundaryProps, ErrorBoundaryState> {
    public componentDidCatch(error: Error, errorInfo: ErrorInfo): void {
        Sentry.captureException(error, {
            extra: { componentStack: errorInfo.componentStack },
        })
    }

    public render(): ReactNode {
        if (this.state.hasError) {
            return this.props.fallback ?? <DefaultFallback />
        }
        return this.props.children
    }
}
The componentStack in the extra field is critical. A JavaScript error like “Cannot read property ’name’ of undefined” could come from anywhere. The component stack trace shows the exact React component tree: App > Dashboard > InvoiceTable > InvoiceRow, which pinpoints the failing component without requiring reproduction. This is exactly how we caught the two useAuth must be used within an AuthProvider issues listed in the Real-World Value section.
Structured JSON Logging
Error monitoring captures exceptions. Structured logging captures everything else: successful requests, slow queries, rate limit hits, authentication failures. Every HTTP request is logged as a single-line JSON object:
# apps/api/src/app/middleware/logging.py
class JSONFormatter(logging.Formatter):
    def format(self, record: logging.LogRecord) -> str:
        return json.dumps({
            "timestamp": datetime.now(UTC).isoformat(),
            "level": record.levelname,
            "method": getattr(record, "method", None),
            "path": getattr(record, "path", None),
            "status": getattr(record, "status", None),
            "duration_ms": getattr(record, "duration_ms", None),
        })
The middleware measures request duration using time.perf_counter() (monotonic clock, not wall clock) and emits one log entry per request. JSON format means these logs are parseable by any log aggregation tool without regex.
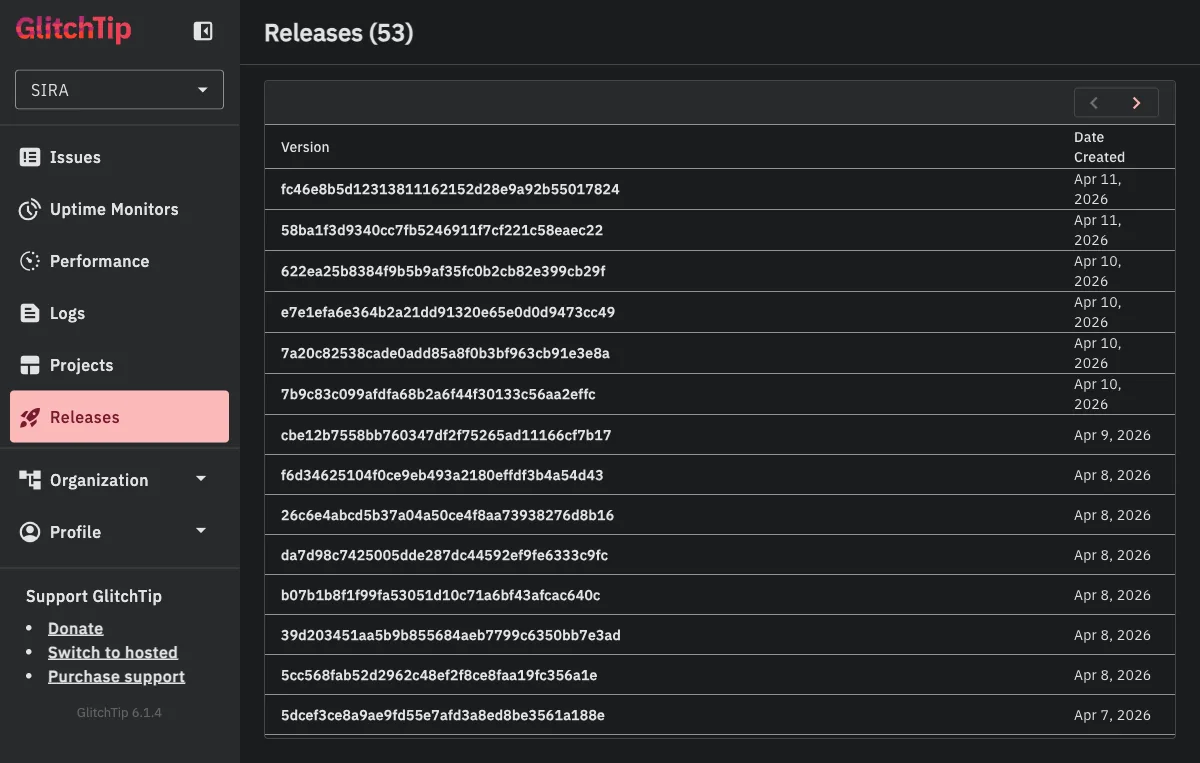
Release Tracking in CI/CD
Every deployment creates a GlitchTip release tagged with the git commit SHA:
# .gitlab-ci.yml deploy:promote stage
curl -sS -X POST \
    "${PROD_GLITCHTIP_DOMAIN}/api/0/organizations/sira/releases/" \
    -H "Authorization: Bearer ${PROD_GLITCHTIP_API_TOKEN}" \
    -d "{\"version\": \"${CI_COMMIT_SHA}\", \"projects\": [\"sira-api\", \"sira-web\"]}"
This creates a timeline of deployments in GlitchTip. When a new error appears, you can see which release introduced it. When an error disappears, you can see which release fixed it. The release creation is non-blocking (|| true on failure) so a GlitchTip outage never blocks a production deploy.
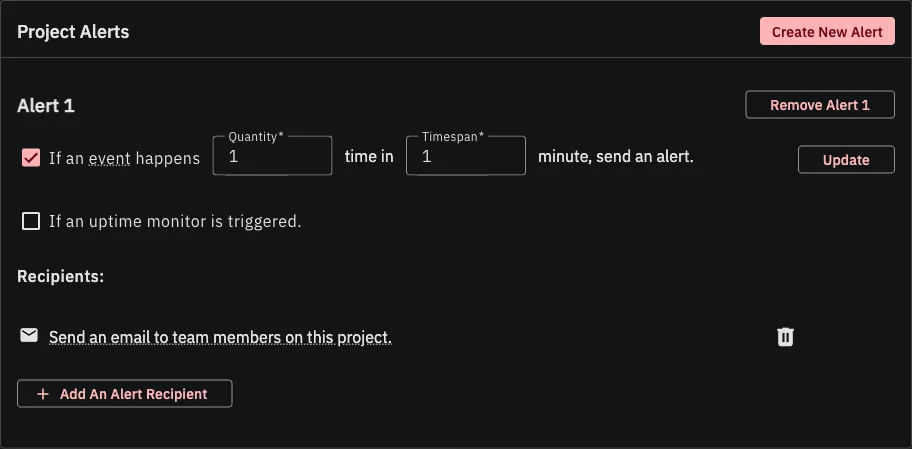
Alert Rules: The Tunable Part
Monitoring data is useless if nobody looks at it. Both projects (sira-api and sira-web) have an alert rule configured: “If an event happens 1 time in 1 minute, send an alert.” The recipients are the team’s email distribution AND a Discord webhook that posts into our #alerts channel.
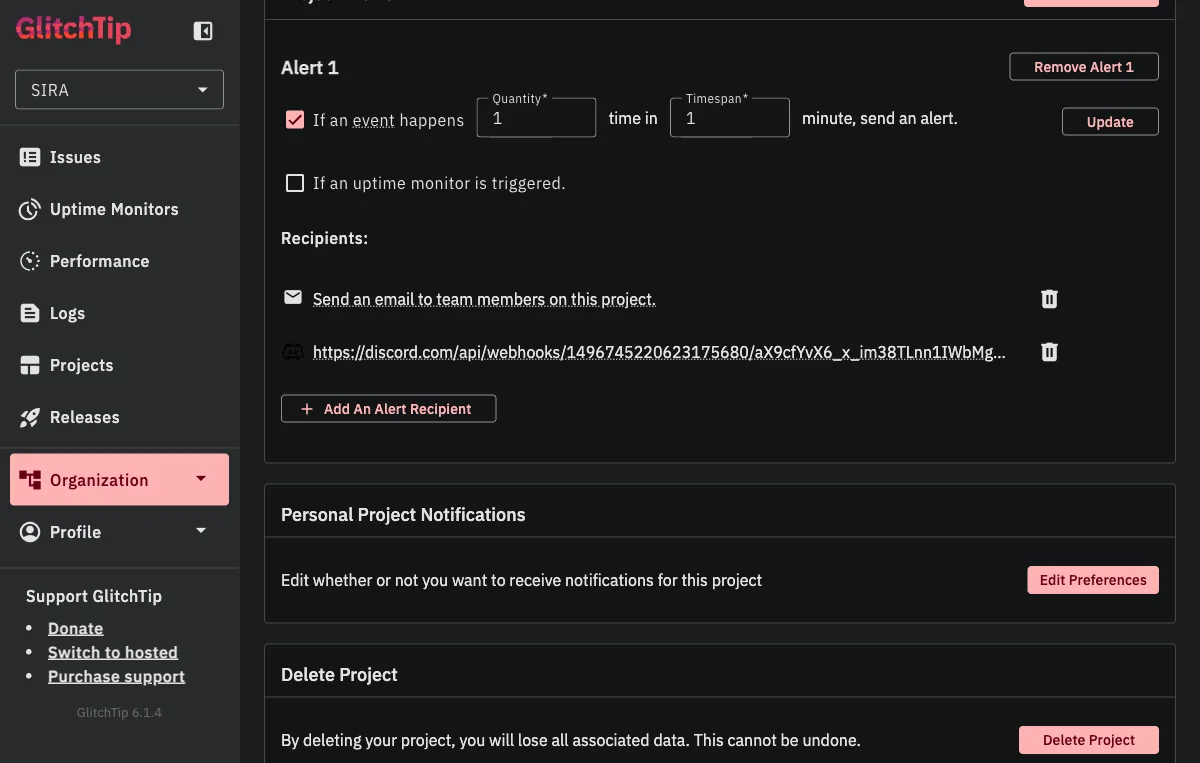
This is intentionally aggressive. In production, any unhandled exception is worth investigating immediately. The team receives both the email and a Discord ping within seconds of the first occurrence, before users have a chance to notice or report the issue.
The alert rule itself has three knobs you can tune:
| Knob | Default | When to change |
|---|---|---|
| Quantity (events) | 1 | Raise to 5-10 for noisy endpoints where a single timeout is normal but a pattern is not. |
| Timespan (minutes) | 1 | Extend to 5-15 if your quantity is higher; prevents alert storms during an outage. |
| Recipients | Add webhooks for each channel you want to notify (Discord, Slack, Teams). GlitchTip supports generic webhook URLs so any modern chat system works. |
The 1-event-in-1-minute threshold means the alert fires on the first occurrence, not after accumulation. For a system that should have zero unhandled exceptions in steady state, any exception is a signal worth acting on. If our error volume grows past what the team can triage, the quantity knob is the first thing to raise.
What This Architecture Enables
| Layer | What it monitors | How |
|---|---|---|
| FastAPI | API exceptions, request latency | Sentry SDK auto-capture + custom start_span |
| Celery | Task failures, retry exhaustion | CeleryIntegration + set_context metadata |
| React | Component crashes, JS errors | ErrorBoundary + browserTracingIntegration |
| Nginx | Request routing, health checks | Access logs + health endpoint exemption |
| CI/CD | Release correlation | Commit SHA tagged on every deploy |
The key insight is that monitoring is not a single tool or dashboard. It is layers: error capture for crashes, performance spans for latency, context tagging for debugging, structured logging for everything in between, and alerts for immediacy. Each layer answers a different question, and together they provide visibility into a system where three services (API, workers, frontend) run across two processes and one browser.
The 14 issues captured in the Real-World Value section are the proof: every one of them is a bug that this layered setup caught before it reached a user. The most expensive bug is the one that runs silently for weeks; the cheapest bug is the one that emails you within seconds of its first occurrence.